Thursday, March 4, 2021

math behind the guilloche

These are the parts of the program that draw each section in case someone wants to know the math.


This is the first set of spirals.


for (float theta = 0.0; theta < 16.0 * PI + 0.02; theta = theta + 0.02){
float radius = 120.0 * theta / (16.0 * PI);
radius = radius + sin(theta * 12.0) * theta * 15.0 / (16.0 * PI);
float xp = sin(theta) * radius;
float yp = cos(theta) * radius;
draw(xp,yp);
}


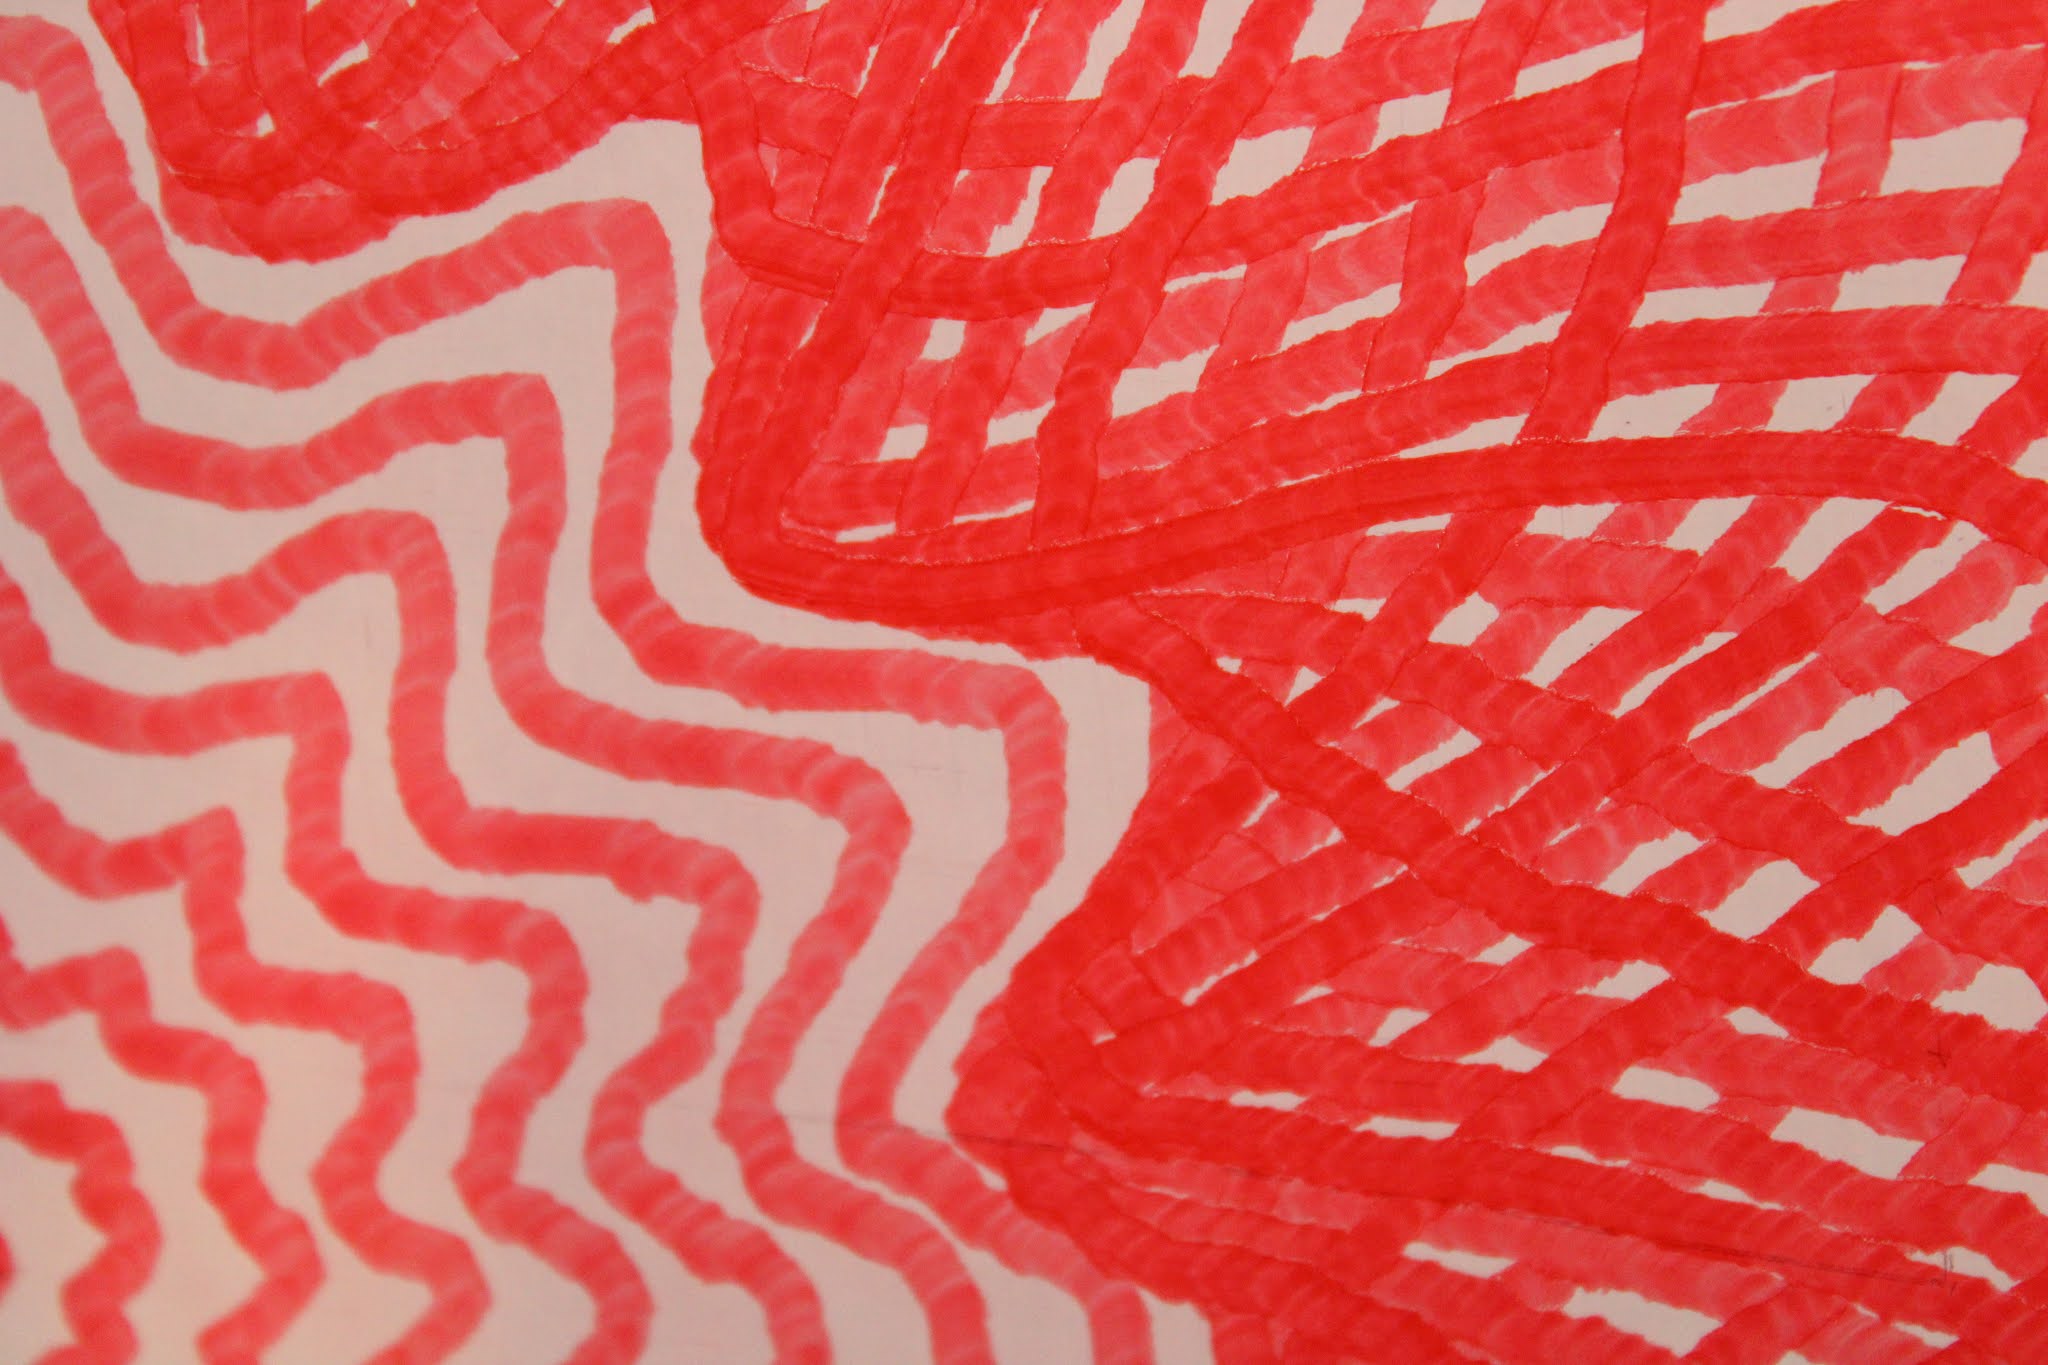
Then there is a section that is kind of like a spirograph except it also weaves in and out as it goes around.
  for (float theta = 0.0; theta < 32.0 * PI + 0.02; theta = theta + 0.02){
    float radius = 180.0;
    radius = radius + sin (theta * 6.1875) * 60.0 + sin(theta * 12.0) * 15.0;
    float xp = sin(theta) * radius;
    float yp = cos(theta) * radius;
    draw(xp,yp);
    }
 

This next section is kind of like figure eights but wrapped around the circle and weaving in and out to match to previous section.
for (float theta = 0.0; theta < 2.0*PI+2.0*PI/14400.0; theta = theta + 2.0*PI/14400.0){
  float radius = 255.0; //the distance from 0,0 to the center of the figure eights
  float newTheta = sin(theta*200.0)*2.2*PI/150.0+theta;
  float newRadius = radius + sin(theta*100.0)*10.0 + sin(theta*12.0)*15.0;
  float x = sin(newTheta)*newRadius;
  float y = cos(newTheta)*newRadius;
  draw (x,y);
}
It tries to draw the loops a little smaller than the plotter is able to do because of the drag of the pen.

The next section is like the second section but the inner edge goes in and out 12 times while the outer section goes in and out only 6 times as it makes 99 waves all together.
for (float theta = 0.0; theta < 32.0*PI+0.02; theta = theta + 0.02){
  float radius = 335.0;
  float newRadius = radius + sin(theta*6.1875)*65.0;
  float newRadius2 =newRadius + (400.0-newRadius)/8.667*sin(theta*12.0);
  float newRadius3 = newRadius2 + (newRadius-270)/4.333*sin(theta*6.0);
  float x = sin(theta)*newRadius3;
  float y = cos(theta)*newRadius3;
  draw (x,y);
}

The last section just makes some spirals that are close together like the first set only they just go in and out 6 times instead of 12.
for (float theta = 0.0; theta < 2.0*PI*6.0+2.0*PI/360.0; theta = theta + 2.0*PI/360.0){
  float radius = 400.0;
  float newRadius = radius + sin(theta*6.0)*30.0+theta;
  float x = sin(theta)*newRadius;
  float y = cos(theta)*newRadius;
  draw (x,y);
}


Sunday, February 28, 2021

Guilloche time lapse

 I videoed this as a series of one minute videos. It actually took about two hours to plot. It was inspired by this guy.

https://youtu.be/qjc-oAkoKvY

I am a fan of the axidraw plotter and look what people are doing with it.

I have slow internet so I was going to upload a bunch of short videos and got tired of doing them all.

I found some shareware that would help me link them all together and speed it up. So it is not a normal timelapse made from a bunch of photos.

After I drew it I zoomed in and took some photos up close. There are some interesting textures.


Thursday, February 18, 2021

Cardioid

 Today I was inspired by this guys pictures.

http://inkylines.blogspot.com/2019/05/full-gallery-httpswww.html

Here is what I did with it.


Saturday, January 2, 2021

Waves Flower1 Flower2 and Slinky

 I did some more pictures from Matthias Wandel.

This is his website where I got the ideas.

http://matt.wandel.ca/artwork/math_art.html

First I did Waves again but bigger than before.


Then I did the one called Flower1.

Then I did Flower2.

Then I did Slinky.


Shingles and Waves

 The idea for these pictures came from this website.

http://matt.wandel.ca/artwork/math_art.html

This is an old website by Matthias Wandel of woodgears.ca fame.

The first picture is one he called "shingles."


This one took about two hours to draw. 
I'm hoping to get a better camera so I can start posting more timelapse videos of these drawing.


Saturday, July 6, 2019

Butterfly

This is another one derived from data for the sandplotters at Sisyphus Industries.
https://sisyphus-industries.com/
The first time I did it I started it going, watched the first part and then went off to work in the yard.
It drew a little bit too big.
So I shrunk it by 10%.
I made videos of both of them. Since this is just drawing the path and not stopping to draw circles it only takes about an hour to draw either one so it appears to move much faster than in previous videos. It is actually sped up by the same amount as the longer videos on previous days.
I also see that I need to cover the window next to the doodler when I film these during the day time.


Thursday, July 4, 2019

This one is Amazing

This one has 6680 x,y points. It fills the memory of the Arduino board to 96%. It took an hour and a half to draw. Here is the timelapse.
I used a different drawing technique for this one. I took one step forward, two steps back and two steps forward each time. Due to the way the doodler works the pen doesn't always repeat so that made some of the lines thicker than others. I got the data for this pattern from the exchange forum for these drawing machines:
https://sisyphus-industries.com/