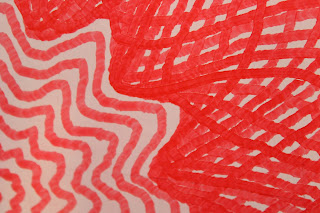
These are the parts of the program that draw each section in case someone wants to know the math.
This is the first set of spirals.
for (float theta = 0.0; theta < 16.0 * PI + 0.02; theta = theta + 0.02){
float radius = 120.0 * theta / (16.0 * PI);
radius = radius + sin(theta * 12.0) * theta * 15.0 / (16.0 * PI);
float xp = sin(theta) * radius;
float yp = cos(theta) * radius;
draw(xp,yp);
}
VIDEO
Then there is a section that is kind of like a spirograph except it also weaves in and out as it goes around.
for (float theta = 0.0; theta < 32.0 * PI + 0.02; theta = theta + 0.02){
float radius = 180.0;
radius = radius + sin (theta * 6.1875) * 60.0 + sin(theta * 12.0) * 15.0;
float xp = sin(theta) * radius;
float yp = cos(theta) * radius;
draw(xp,yp);
}
VIDEO
This next section is kind of like figure eights but wrapped around the circle and weaving in and out to match to previous section.
for (float theta = 0.0; theta < 2.0*PI+2.0*PI/14400.0; theta = theta + 2.0*PI/14400.0){
float radius = 255.0; //the distance from 0,0 to the center of the figure eights
float newTheta = sin(theta*200.0)*2.2*PI/150.0+theta;
float newRadius = radius + sin(theta*100.0)*10.0 + sin(theta*12.0)*15.0;
float x = sin(newTheta)*newRadius;
float y = cos(newTheta)*newRadius;
draw (x,y);
}
It tries to draw the loops a little smaller than the plotter is able to do because of the drag of the pen.
VIDEO
The next section is like the second section but the inner edge goes in and out 12 times while the outer section goes in and out only 6 times as it makes 99 waves all together.
for (float theta = 0.0; theta < 32.0*PI+0.02; theta = theta + 0.02){
float radius = 335.0;
float newRadius = radius + sin(theta*6.1875)*65.0;
float newRadius2 =newRadius + (400.0-newRadius)/8.667*sin(theta*12.0);
float newRadius3 = newRadius2 + (newRadius-270)/4.333*sin(theta*6.0);
float x = sin(theta)*newRadius3;
float y = cos(theta)*newRadius3;
draw (x,y);
}
VIDEO
The last section just makes some spirals that are close together like the first set only they just go in and out 6 times instead of 12.
for (float theta = 0.0; theta < 2.0*PI*6.0+2.0*PI/360.0; theta = theta + 2.0*PI/360.0){
float radius = 400.0;
float newRadius = radius + sin(theta*6.0)*30.0+theta;
float x = sin(theta)*newRadius;
float y = cos(theta)*newRadius;
draw (x,y);
}


